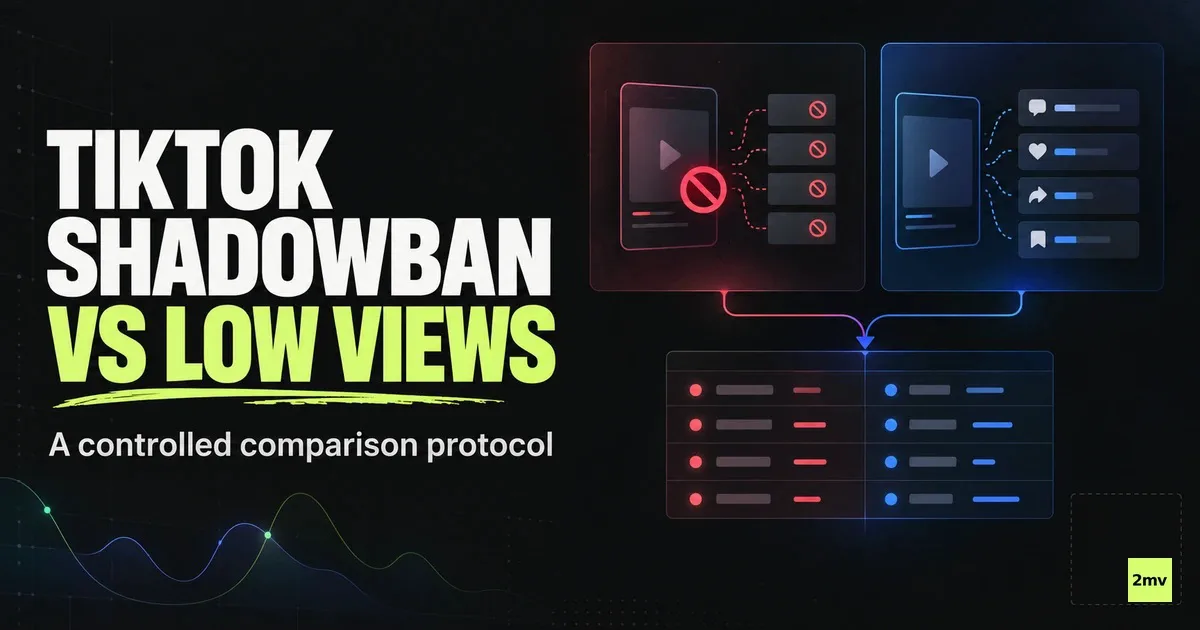
TikTok Shadowban vs Low Views: A Measurement Protocol
The view counter cannot tell a content team whether TikTok restricted distribution or viewers simply responded poorly. Both can end at the same number. The difference appears in the sequence that produced it: what was eligible, where the post was exposed, how viewers responded and whether the pattern repeated across comparable posts.
This is a measurement protocol, not a shadowban checklist. Use it when a team needs evidence it can compare across a batch, report without overstating certainty and hand to TikTok support if an account-wide anomaly persists.
If you need to check TikTok’s official account and post notices, use the platform’s Account Check and recommendation notices first. This protocol begins after that check, when the remaining question is whether the observed decline behaves more like distribution restriction or content performance.
Define the two competing explanations
Write the hypotheses before opening analytics.
Restriction hypothesis: TikTok recommendation or discovery exposure changed at the post or account level, independently of an ordinary change in viewer response.
Performance hypothesis: TikTok exposed the post, but its hook, pacing, topic or audience match did not earn further distribution.
Neither hypothesis should be written as fact at the start. The purpose of the protocol is to find which explanation is better supported and what remains unknown.
Separate three layers throughout the analysis:
| Layer | Question | Evidence |
|---|---|---|
| Eligibility | Can the post or account be recommended? | TikTok notices, Account Check, appeal state |
| Exposure | Where and when was the post shown? | For You, search, profile and follower traffic at fixed checkpoints |
| Response | What did exposed viewers do? | Watch time, completion, early drop-off, shares and comments |
Do not use response metrics to claim eligibility, or a clean eligibility screen to claim strong performance. Each layer answers a different question.
Build a matched cohort
A fair comparison uses posts that could reasonably have behaved alike. Select a recent affected cohort and an earlier baseline cohort. Aim for enough posts to reduce the influence of one outlier; five per cohort is a practical minimum for an incident review, while a larger set is better when the account publishes frequently.
Match the cohorts on the variables that materially affect distribution:
- post age at measurement;
- format and approximate duration;
- topic breadth and audience;
- language and market;
- posting cadence;
- original versus reused material;
- any paid promotion or unusual external traffic.
Do not compare a 12-hour-old specialist tutorial with a three-month-old entertainment hit. Do not use the week after a viral outlier as the account’s “normal.” When view counts are skewed, use the cohort median rather than the mean.
Record excluded posts and why they were excluded. Removing an inconvenient result after seeing the numbers turns a comparison into a story.
Fix the observation checkpoints
Choose checkpoints before evaluating the posts—for example, an early checkpoint and a later checkpoint applied to every item. The precise hours can follow the account’s publishing rhythm; consistency matters more than pretending one schedule fits every account.
At each checkpoint record:
- total views;
- traffic-source mix;
- watch time and completion where available;
- the shape and location of the largest retention drop;
- shares, comments and saves where they help explain response;
- search visibility for one distinctive query;
- any account or post eligibility notice.
The checkpoints preserve sequence. A lifetime total cannot show whether the video received a test audience and failed to expand, never received meaningful For You exposure, or continued accumulating slower search traffic after recommendation slowed.
Avoid editing captions, privacy settings or other relevant variables during the observation window. If a change is necessary, record it and treat subsequent measurements as a new phase.
Code the creative variables
Analytics alone can show a change without explaining it. Add a compact creative record for every post:
- first visible frame;
- first spoken or on-screen promise;
- hook device;
- topic and intended audience;
- duration and format;
- where the payoff begins;
- use of a trend, sound or recognizable template.
This makes the performance hypothesis testable. If every affected post introduces a slower opening or a narrower topic, the cohort is not actually matched. If the creative variables remain stable while exposure changes across the batch, the distribution hypothesis becomes more credible.
The goal is not to tag every edit. Capture only variables that could explain the observed difference.
For a repeatable way to extract those variables, use the frame-by-frame viral video analysis method. Teams that need the same breakdown from a TikTok URL can use the TikTok video analyzer; neither route replaces TikTok’s own eligibility notices.
Read exposure before response
The order prevents a common causal error.
If a post received meaningful For You exposure and viewers left earlier than the baseline cohort, the evidence supports—but does not prove—the performance hypothesis. The distribution system exposed the video; weaker viewer response is a plausible reason it did not expand further.
If exposure is unusually low, response metrics may be based on too few or too different viewers to explain the outcome. Healthy retention in a tiny sample does not prove restriction, and weak retention in a tiny sample does not rule it out.
Use the pattern across the cohort:
| Exposure pattern | Response pattern | Working interpretation |
|---|---|---|
| Comparable exposure | Weaker response | Performance explanation strengthened |
| Lower exposure | Comparable response | Distribution anomaly, topic ceiling or eligibility issue remains open |
| Lower exposure | Weaker response | Inconclusive; both the audience delivered and the content may differ |
| Comparable exposure | Comparable response | Check topic size, measurement window and later distribution |
“Working interpretation” is deliberate. These combinations guide the next test; they are not platform-internal proof.
Check whether the anomaly is post-level or account-level
Create a row for each affected post and add two controls: one older post that normally receives discovery traffic and one new post in a familiar format.
An anomaly is more likely to be post-level when:
- TikTok identifies one video as ineligible;
- neighboring posts still receive their usual discovery mix;
- older posts continue gaining search or For You traffic;
- the affected video has a distinct policy, originality or creative issue.
An account-level investigation becomes more reasonable when:
- multiple matched posts lose the same discovery surface at approximately the same time;
- older posts also lose their normal discovery trickle;
- exact-query visibility changes across several posts;
- TikTok displays an account-level recommendation notice.
TikTok states that repeatedly posting content unsuitable for For You can make an account and its posts ineligible for For You and harder to find in search, with notification and appeal available. Use TikTok’s current account recommendation guidance as the authority for that state, not an inferred score.
Run one controlled publishing test
Do not change the entire content strategy in response to one abnormal batch. Publish a small controlled set in which each post changes one meaningful variable.
One useful design is:
- a control post in a familiar topic and format;
- a variant with a stronger opening but the same topic;
- a variant with a broader topic but the familiar format;
- where relevant, a new original treatment replacing reused material.
Measure all of them at the same checkpoints. If the control distributes normally, an account-wide restriction becomes less likely. If a hook change restores expansion while eligibility and exposure remain available, performance is better supported. If every controlled post loses the same discovery surfaces despite clean creative and policy checks, preserve the evidence and escalate the account investigation.
This is not an instruction to flood the account with tests. A small, interpretable set is more useful than many uploads that alter several variables at once.
Use explicit decision states
Avoid a percentage score unless it has been validated against known platform outcomes. Use evidence states instead.
Confirmed restriction
TikTok explicitly identifies a post or account as ineligible for recommendation. Record the scope, reason, date and appeal state.
Strong distribution anomaly
Several matched posts lose the same discovery surfaces; response does not adequately explain the change; controls behave abnormally; no official confirmation is available.
Performance more likely
Exposure remains available and the affected cohort shows weaker early response, a changed topic pool or a changed creative pattern.
Inconclusive
The sample is small, cohorts are not comparable, exposure is insufficient to interpret response, or multiple variables changed together.
An inconclusive result is not a failed analysis. It tells the team exactly what evidence the next test must create.
Report observations separately from explanations
Use a four-line incident summary:
- Observation: what changed, across how many matched posts and which surfaces.
- Leading explanation: restriction, distribution anomaly, performance or unresolved mix.
- Confidence: confirmed, strong, moderate or weak, with the reason.
- Next test: the smallest action that can distinguish the remaining explanations.
For example:
Observation: For You exposure fell across five matched tutorials while the earlier cohort remained discoverable. Leading explanation: an account-level distribution anomaly. Confidence: moderate; Account Check is clean and no recommendation notice appears. Next test: publish one familiar-format control and repeat the fixed-checkpoint comparison.
This structure prevents a hypothesis from silently becoming a company fact. It also produces a support request containing dates, post URLs and surface-level changes instead of the unsupported statement “we are shadowbanned.”
Know what the protocol cannot prove
Public and creator-facing analytics do not reveal every ranking decision. Search results are personalized, small samples are unstable and TikTok does not publish a universal minimum exposure level. A controlled comparison can strengthen one explanation, but it cannot reconstruct the platform’s internal decision system.
That limitation is why opaque “83% shadowbanned” scores are misleading. A tool can organize evidence, detect a departure from an account’s own baseline and route a creator to official checks. It cannot convert public view counts into a private platform verdict.
The operational conclusion
Treat TikTok shadowban versus low views as a measurement problem with two competing explanations. Match the posts, fix the checkpoints, separate eligibility from exposure and response, run one controlled test and report confidence honestly.
The protocol does not promise certainty where TikTok provides none. It gives a team a repeatable way to decide whether to appeal, investigate distribution, revise the creative or collect better evidence next. Use the TikTok Shadowban Checker to classify a completed evidence set, or return to the broader TikTok view-drop diagnosis when restriction is only one of several plausible causes.